In order to interpret the down hole with the direct method, initially, we must correct the travel times (t) measured along the source-receiver paths to take into account the inclination of the path of the waves. If d is the distance from the source axis of the hole (Figure 1), r the distance between the source and the triplet of sensors, z the depth and we can get the correct time ( tcor ) using the following conversion formula:
![]()
Formula 1.0
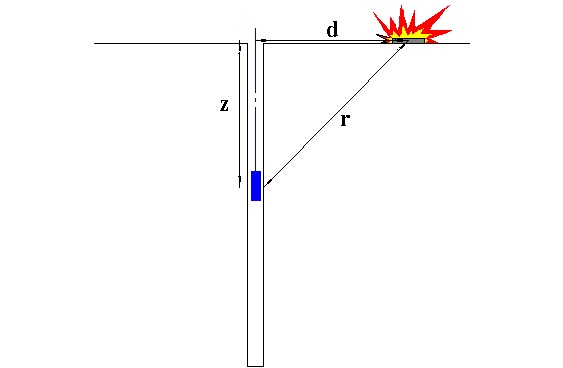
Figure 1 – Schematic down hole with direct method
The corrected time for the P waves and for S waves being calculate, is drawn the graphic tcor – z, so that the average speed of seismic waves in homogeneous layers of soil is represented by the inclination of the line segments along which are aligned to the experimental data (Figure 2).
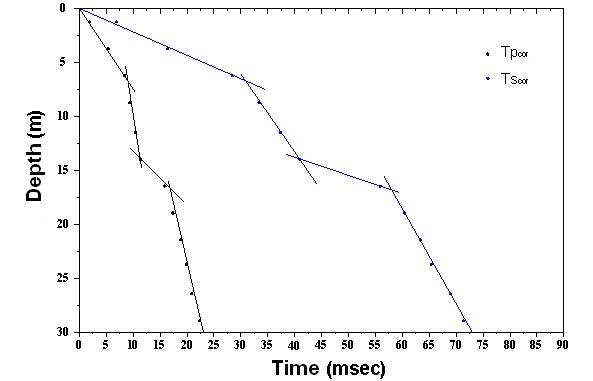
Figure 2 – Time travel graphs
Once the seismic layers are graphically obtained, you get the average density, from the speed and depth, and the following parameters:
1. average Poisson's ratio:
2. average shear deformation modulus:
![]()
3. average oedometric modulus:
![]()
4. average Young's modulus:
![]()
5. average bulk modulus:
© GeoStru