Once the input phase is done, the software is able to determine the blocks motion as a function of the impacts on the soil and on eventual barriers previously defined. The trajectories are displayed on the graphic as they are calculated by the program.
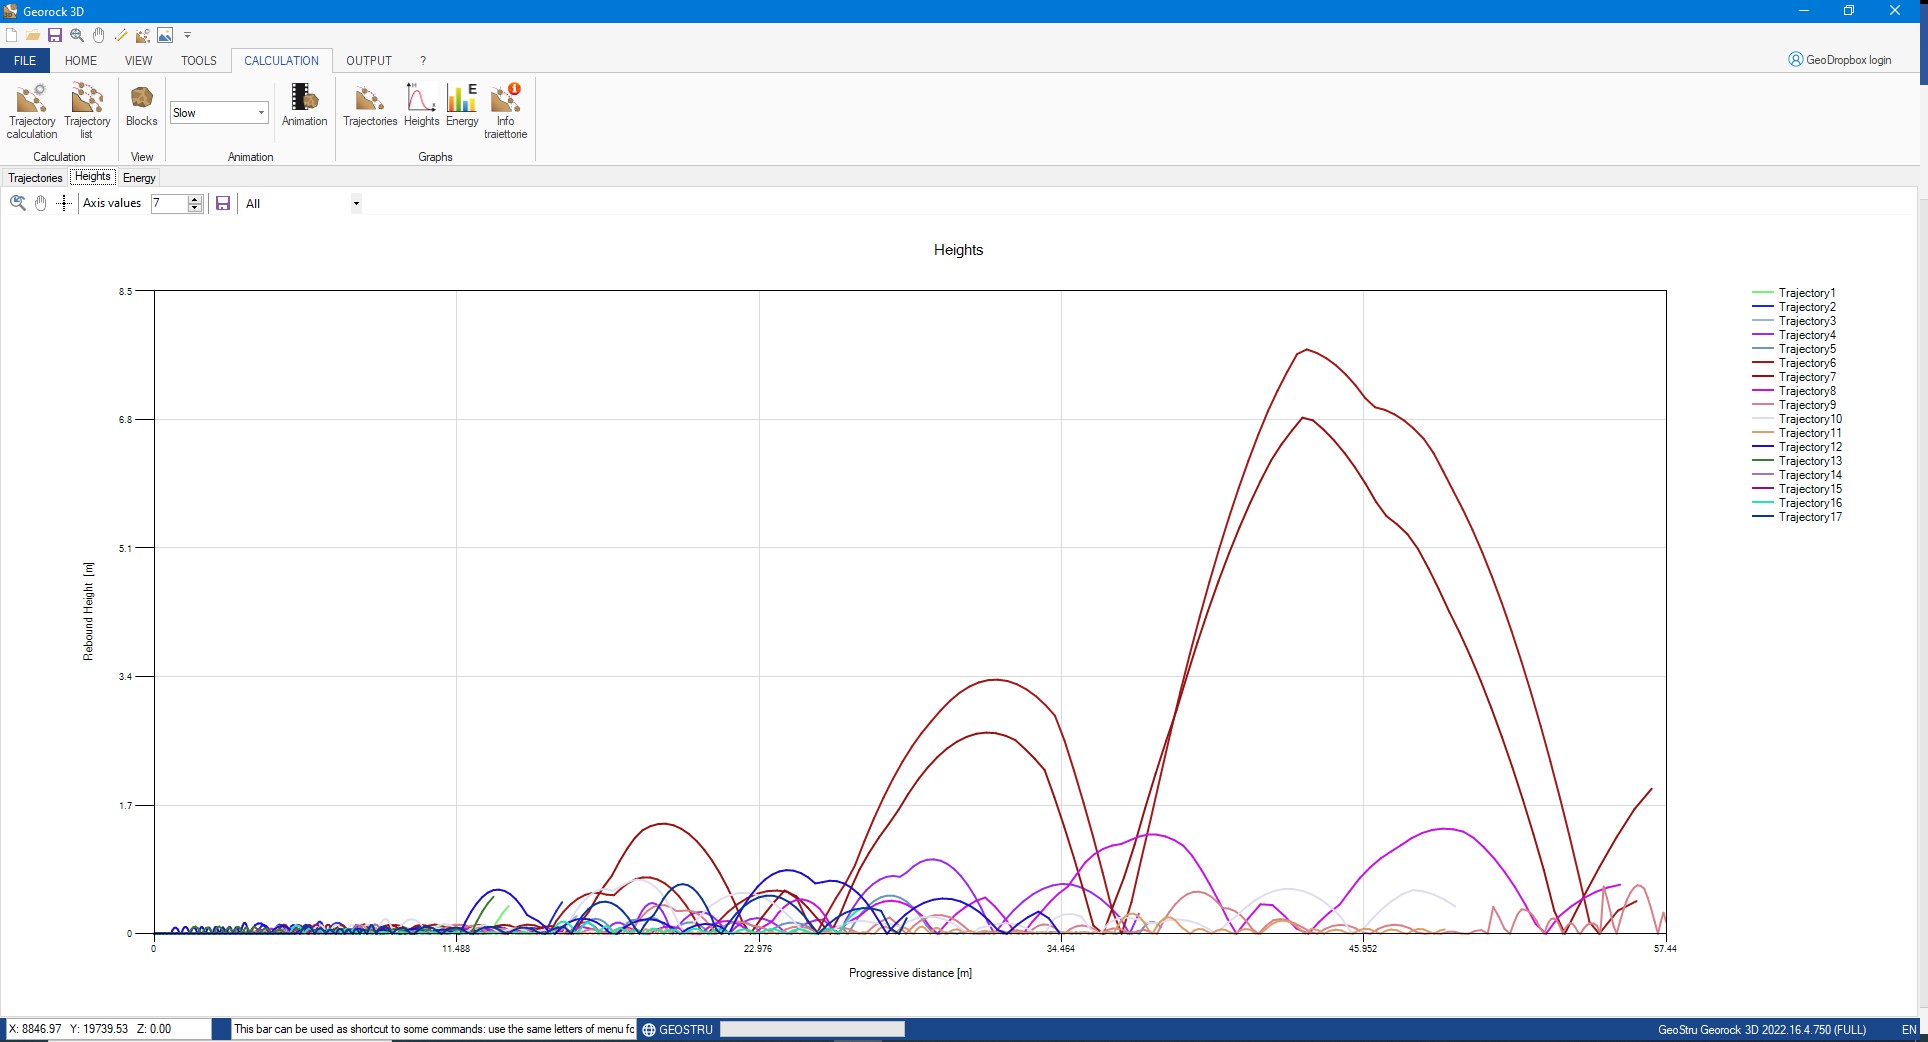
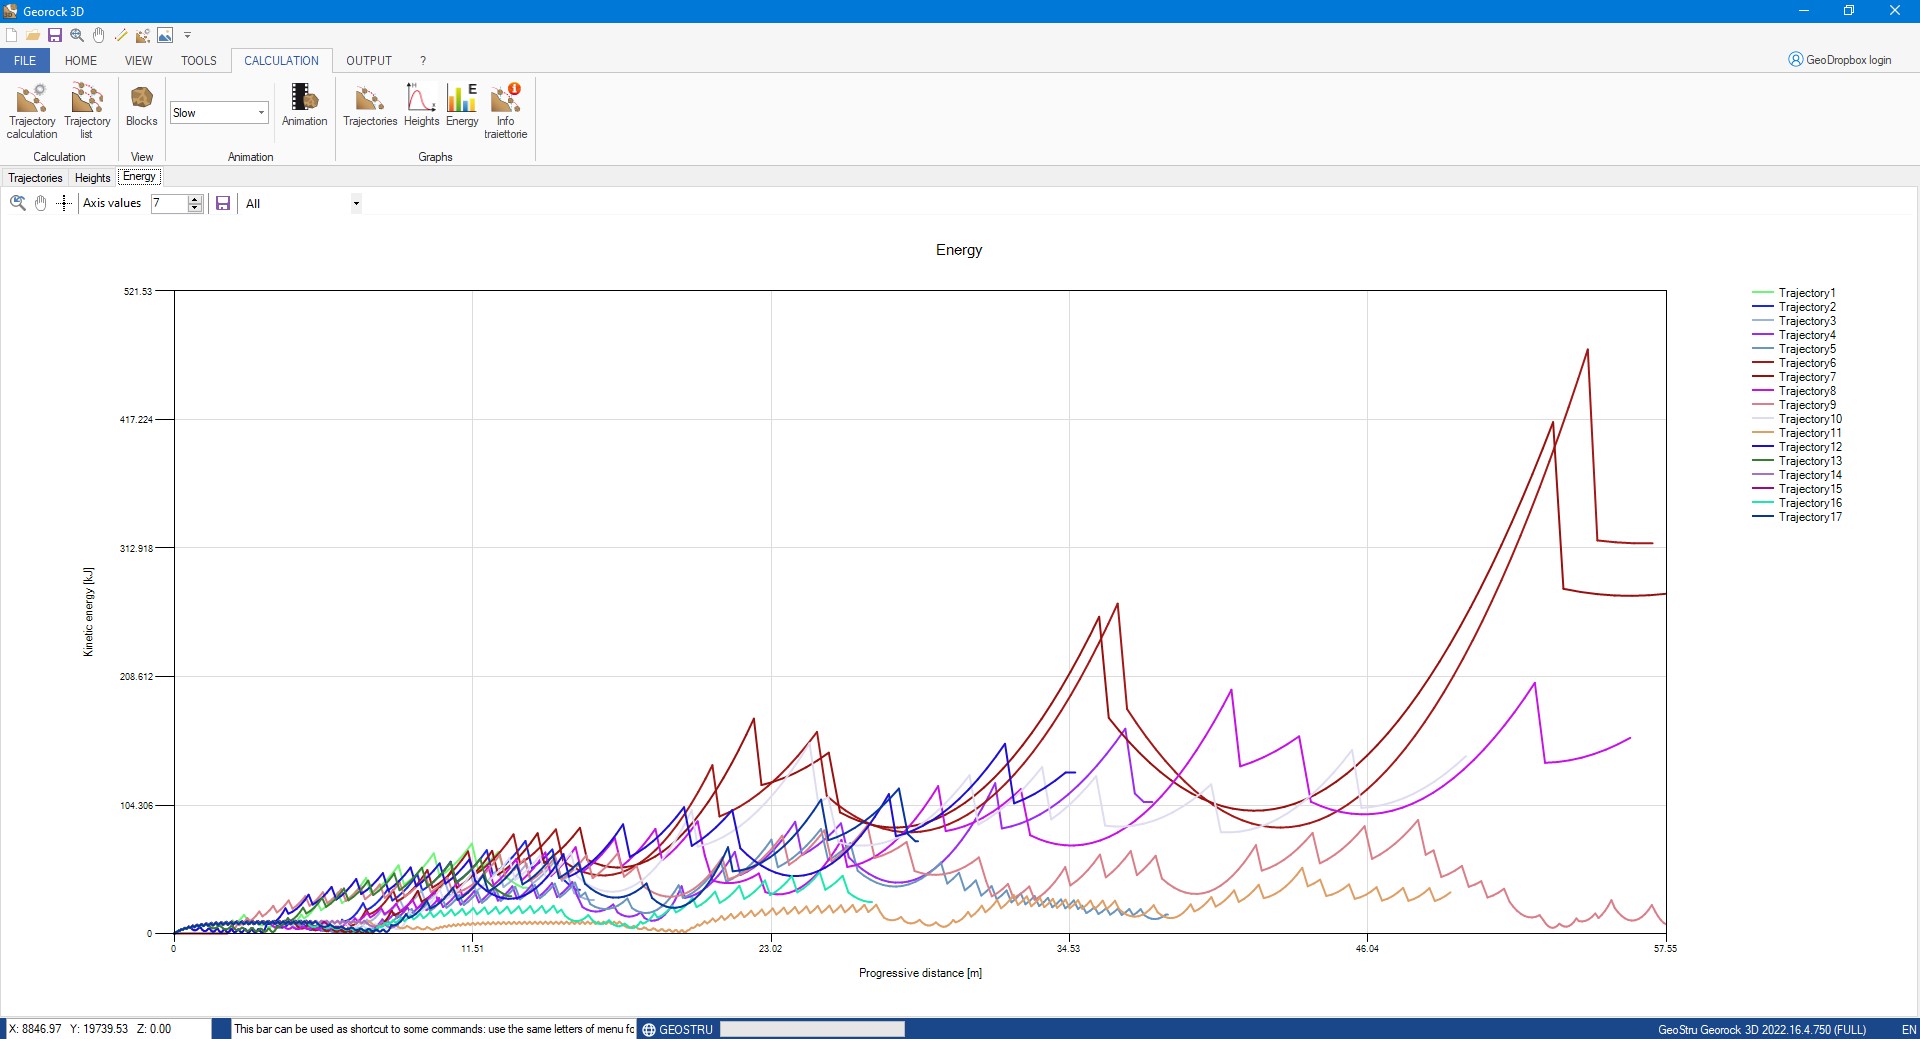
For every trajectory information as block initial position, minimum and maximum velocity values and absolute position are available. The user can choose to view only the trajectories he is interested in. By scrolling with the mouse on a trajectory, the block's elevation, the velocity (as a module) and the energy in that point are displayed.
|
© 2022 Geostru Software