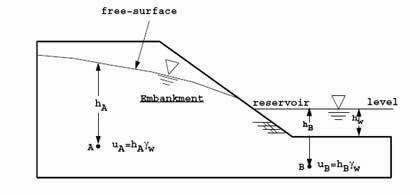
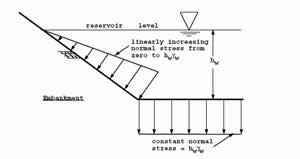
Pore pressures and external water pressures can be generated on the basis of phreatic levels (water table). A phreatic level represents a series of points where the water pressure is zero. Using the input of phreatic level, the water pressure will increase linearly with the depth according to the specified water weight, the pressure variation is assumed to be hydrostatic. The external loading due to the reservoir is modelled by applying a normal stress to the face of the slope equal to the water pressure. Thus as shown in the Figure 47 the applied stress increases linearly with water depth and remains constant along the horizontal foundation level. These stresses are then converted into equivalent nodal loads on the finite element mesh.
Phreatic levels are defined by two or more points and do not interact with the geometrical model. Above the phreatic level the pore pressures will be zero, whereas below the phreatic level there will be a hydrostic pore pressure distribution at each Gauss integration points.
Steady state pore pressures and external water pressures are generated in the water conditions mode. Water pore pressures can be generated on the basis of phreatic levels or alternatively, water pressures may be generated by means of a steady-state groundwater flow. The initial groundwater conditions can be generated in two different modes: the first consists in the definition of the phreatic levels and generation the water pore pressures amd second through an explicit steady state flow analysis, that require a definition of the total heads on the finite element mesh boundaries.
|
Fig.46. Free surface modelling. |
|
Fig.47. Reservoir loading. |
|
|
|
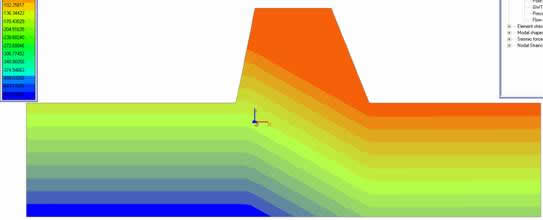
Fig. 48. Pore pressure distribution. |
|
Fig.49. Hydraulic boundary conditions. |
|
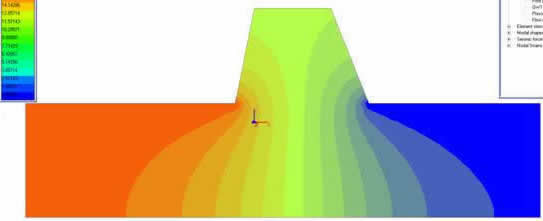
Fig.50. Steady state flow analysis. Total heads distribution. |
|
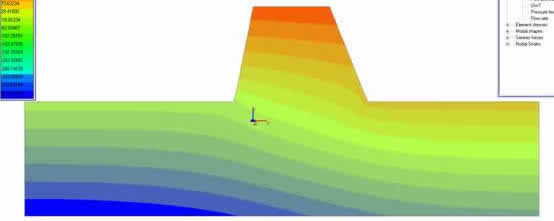
Fig.51. Steady state flow analysis. Pore pressure distribution. |
|
© GeoStru Software