HIGH FLOOD MAPPING
Apart from the climax flow it may be useful to know the flow' s evolution, in the section referred to, depending on the period.
The construction of such a graphic is obtained with the method proposed by Nesh:
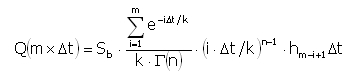
where:
Q(m·Δt) = the instantaneous flow m·Δt, with m variable from 1 to N;
N = the maximum number of intervals considered;
Δt = the temporary time interval (1 hour);
m = interval number;
Γ(n) = the gamma function;
Sb = basin's area [Km²];
hm-i+1 = the effective inflow [mm] in the interval (m-i+1);
k, n = basin's characteristic coefficients.
For estimating the coefficients k and n there are available several correlations, the program uses:
Nash (1960)
n and k are known by determining the m1 and m2 parameters with:
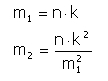
with:
m1 = 27.6·A0.3·ib-0.3
m2 = 0.41·L-0.1
where:
A = basin's area expressed in square miles;
L = water course length, prolongated, in mules;
ib = basin's medium inclination in parts on 10000.
Mc Sparran (1968)
Mc Sparran calculates:
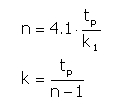
with:
tp = 5.52·A0.208·i-0.447
k1 = 3.34·A0.297·i-0.354
where:
A= basin's area expressed in square miles;
i = the medium inclination of the water course in parts on miles.