In this window can be calculated the differential settlements by assigning the "Stratigraphic areas" and "Load areas".
To each Stratigraphic area can be associated its own stratigraphy whose characteristics are assigned in the "Soil stratigraphy" menu, in "General data" main tab.
In the "Areas" section of the right side menu the user can, first of all, create the "Stratigraphic areas".
For each of these area is assigned a "Description", the location in the plan through the coordinates "x", "y" and "z", the base "B" and length "L", a "Color" and its own "Stratigraphy".
For the "Load areas" are assigned the "Description", the position, the base "B", the length "L", the height "H" and the type "T", the "Color" and the "Load ".
The "T" option allows you to specify the use of a cylindrical load by assigning the character "c" or a rectangular load by entering "1".
For the correct input of data is necessary to use the ";" as a separator in the input box according to the standards suggested in the table header.
In the "Preferences" section of the side menu can be assigned parameters to be used for the analysis and synthesis of data.
Here can be modified the construction step of the mesh, both along the x abscissa and the y coordinate, the density of the settlement isobars and also the size of the texts.
The user can also choose to display the value of the settlement and the settlement isobars. The scale factor of textures and settlements allow better visualization of the results.
In the "Analysis" section of the side menu are generated the results that are reproduced in the diagram along with the mesh used. Scrolling with the mouse on the drawing shows the value of the settlement corresponding to the pointer.
After the analysis is done can be created a section corresponding to the red dotted line that can be adapted to suit the user's needs by using the mouse or by setting the values in the menu.
The "View table" option displays the values of settlements corresponding to distances for the calculated section.
This section, together with the table, can be dragged with the mouse in the drawing.
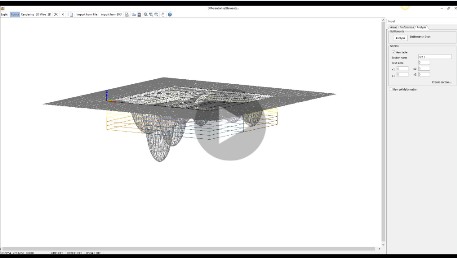
From the top menu can be chosen a solid 3D view of the work by using the "Rendering" command.
The "Rotate" command allows the rotation of the drawing in space, while the "3D Wire" command allows a vision of the project boundaries, settlements and the 3D mesh.
This option "2D" brings back to the plan view.
Importing external files
To perform the analysis of differential settlements on files imported from other programs file as shown below must be prepared:
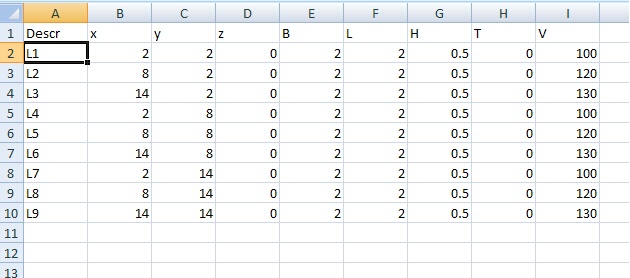
The created file should be saved in TXT or CSV format, with values separated by tabs. Examples of import files are located in the program installation folder.
To import the file right-click on data grids.
|
Import from DXF file
The dxf file must be formed by rectangles which have to be drawn on the following layers: LAY1 for stratigraphic areas, LAY2 loading area. An example can be found in the example folder of the software.
© GeoStru