The strength test shall be carried out in all the sections corresponding to the steps or to the separation between the gabions, in addition to the intermediate sections at the points of discontinuity. The rectangular near-inflected section is checked and sheared, consisting of non-reactive tensile material or with weak resistance. For gabion walls, the tensile strength of the material is always assumed to be zero.
The reactant section will turn out to be a partialization of the whole, and only in it will be active a certain distribution of internal stresses. In general, if the section is entirely reactive, the diagram of normal voltages will be trapezoidal, possibly interwoven;
If the cross-section is partialized and the material is not a tensile reagent, the diagram of the reacting part shall be triangular with a zero point at the neutral axis; if the cross-section is biased and the material has a certain tensile strength, the diagram shall be a butterfly, with a minimum value equal to the maximum tensile strength and a maximum such that the integral of the pressures balance the stress system.
Internal stability checks
This check is required to verify that the reaction caused by normal stress σi and tangential τi inside the structure (the subscript "i" indicates internal) must be below the corresponding limit values σilim and τilim, in such a way as to avoid the possibility of recording excessive deformations that can compromise the stability of the work. The values of the efforts σilim and τ ilim the following can be deduced from empirical formulas:
![]()
![]()
Where:
•γgabbioni gabions is the volume weight of the filling, which depends on the lithological nature of the filling and the degree of thickening, [t/m3].
•ϕ* is the fictitious internal friction angle of gabions, which is evaluated through an empirical formula ϕ* = 25γgab – 10°. This parameter depends, for obvious reasons, on the thickening of the filling stone material (the specific weight of the same provides indications).
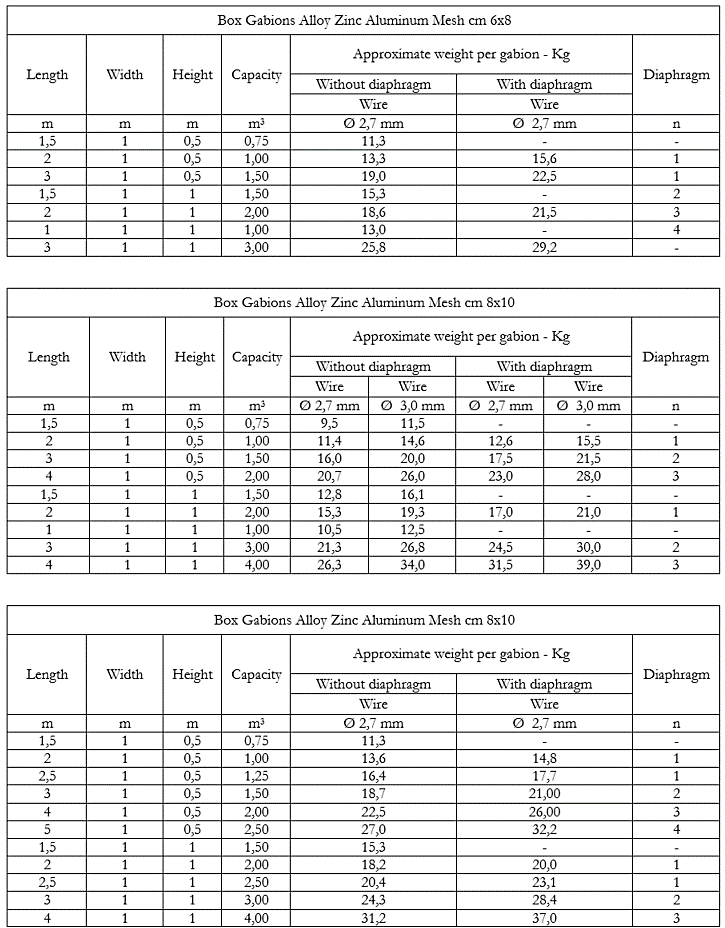
•Cgab it’s the fictitious cohesion, attributable to the presence of the metal mesh. It is estimated through a formula of an empirical nature,Cgab = 0.03.Pu – 0.05, where Pu is the weight of wire mesh present in a cubic meter of work, [Kg/m3]. This parameter can be deduced from the tables below, where the approximate weight of the various gabions can be deduced depending on the type of mesh, the diameter of the thread used, the presence or absence of diaphragms, etc.
When the normal stresses acting at the downstream edge σvi and the upstream edge σmi of the test section are determined by observing that these stresses are caused by stress composed of pressure bending:
![]()
![]()
where:
•N is the sum of all forces normal to the base plane of the work acting on the calculation section.
•Bbase is the length of the base plane.
•e is the eccentricity of the result of the forces acting on the work, i.e. the distance of its meeting point with the verification section measured by the center of gravity of the section itself.
![]()
•u represents the distance of the point of intersection between the line of action of the resultant of the forces acting on the cage and the base plane, measured from the valley edge.
![]()
The stabilizing moment Mstab and the reversing moment Minstab are evaluated with respect to the valley edge of the work.
The shear stress acting at the verification section turns out to be:
![]()
where:
•T is the result of all tangential forces acting in the verification section.
•Bbase is the length of the verification section.
Indicated with σmax and σmin respectively the maximum value and the minimum value between σvi and σmi, the checks in question are passed if the conditions are verified for each limit state
Ed≤Rd
Ed it’s the design value of the action or effect of the action understood as the result of the integration of the effort diagram. Rd is the design value of the resistance of the geotechnical system calculated as a result of compressive limiting stresses.
The shear resistance of the additional bars was determined according to Ec3
Shear design resistance =0.6 * (Tensile strength bar) * (bar area) / 1.25) * Number of bars.
© Geostru