Accelerogram generation
The seismic action that is manifested in a generic site is characterized in a complete known the time history of the accelerations, velocities and displacements of the soil. It is obvious that a knowledge of that detail can not be obtained solely on the basis of macroseismic parameters, such as the magnitude M and the focal position R.
These two parameters, apart from being of physical-empirical nature (unlike the parameters that will be derived from them, which are entirely physical), do not distinguish the particularities of the various mechanisms that can generate the seismic event. In addition, the local effect is profoundly influenced by the geological and morphological conditions of the portion of crust traversed by the waves, and by the stratigraphic and geotechnical conditions of the site
On the other hand, in the present state of knowledge the two macroseismic parameters are the only ones for which one can obtain a degree of information concretely usable for analysis of seismic risk.
To arrive at the definition of the local seismic motion is ultimately necessary to resort to simplified schemes, in which the macroseismic parameters are integrated with information of empirical nature (statistical analysis of records of past earthquakes) or, failing this, with elements based on appropriate considerations of specific data of the problem: distance from potential sources, local characteristics of the soil, etc.
A simplified model of the local seismic motion (ex., the time history of the acceleration), adequate for a number of practical situations, is represented by the expression:
![]()
where:
•a represents the parameter of intensity, and precisely the peak value of the acceleration of the soil, and is a random variable, whose distribution is obtainable according to the randomness of magnitude M and the focal distance R;
•the terms Cn are the normalized development coefficients in the Fourier summation. They describe the frequency content of the motion, as they provide the relative importance of the different frequency elementary components ωn
The diagram of the coefficients Cn as a function of the frequencies ωn represents the FOURIER spectrum of the considered seismic event.
The coefficients Cn are normalized so that the summation in the second member of (1) has a unit maximum value, so that it is:
![]()
in accordance with the definition of a;
•the terms ωn=n2π/D are the pulsations (in rad/s) of the various harmonic components, multiple of the minimum frequency: ω1=2π/ D, where D is the duration of vibration ;
•the terms ϕn are the phase angles, one for each harmonic component, between 0 and 2p.
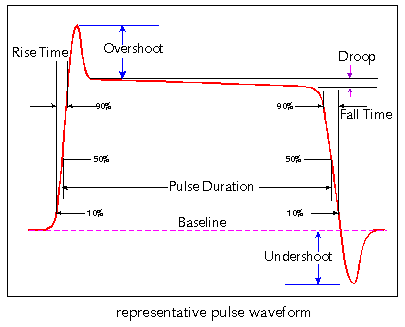
Rise Time
Time to reach maximum acceleration
© GeoStru