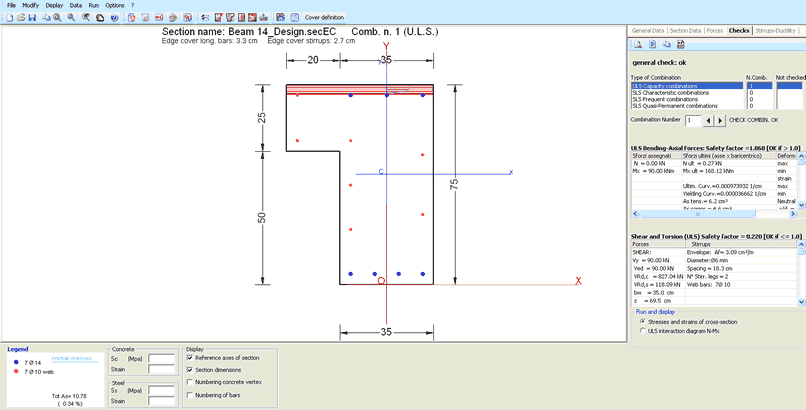
Selecting Checks Tab the program calculates and shows for each assigned combinations (ULS and SLS):
- [Main window] the graphical data (with eventual dimensions) of section with the concrete compressive area (red colored) and the corresponding stress diagram (blue colored); for for T and flanged sections the program generate new bars magenta colored (defined as web bars in the Legend and with diameter as defined in Code and reinforcement option) to sustain the horizontal secondary hoop; if torsion force is present the number of these web bar is such to sustain the longitudinal steel area necessary for torsion.
- [Checks Tab window] the principal results for Bending and Shear (capacity checks for ULS) and for Bending (stress control and crack widths for SLS).
- [Information window] the legend of longitudinal bars, the display options and the stress and strain of bars and of concrete vertices selected by mouse.
Command button of the above Checks Tab bar (from left to right):
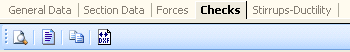
- ![]() Print preview. Capture the image present in the main window and paste it in the Microsoft XPS Document Writer (useful to print the diagram directly on paper):
Print preview. Capture the image present in the main window and paste it in the Microsoft XPS Document Writer (useful to print the diagram directly on paper):
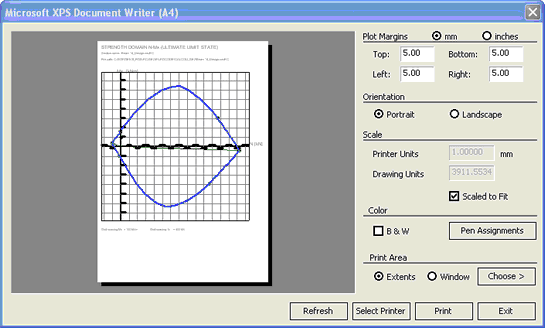
- ![]() Print Checks. Print data input and all the checks in a special Text window allowing a comfortable viewing; you can save the same text to a file with *. doc, *. rtf, *. txt formats.
Print Checks. Print data input and all the checks in a special Text window allowing a comfortable viewing; you can save the same text to a file with *. doc, *. rtf, *. txt formats.
- ![]() Copy. This command copy the image at moment displayed in the main window in the clipboard memory so you can paste it in any document you want:
Copy. This command copy the image at moment displayed in the main window in the clipboard memory so you can paste it in any document you want:
- ![]() Export Dxf. You can save in *.dxf file format the image at moment displayed in main window using a dialog box.
Export Dxf. You can save in *.dxf file format the image at moment displayed in main window using a dialog box.
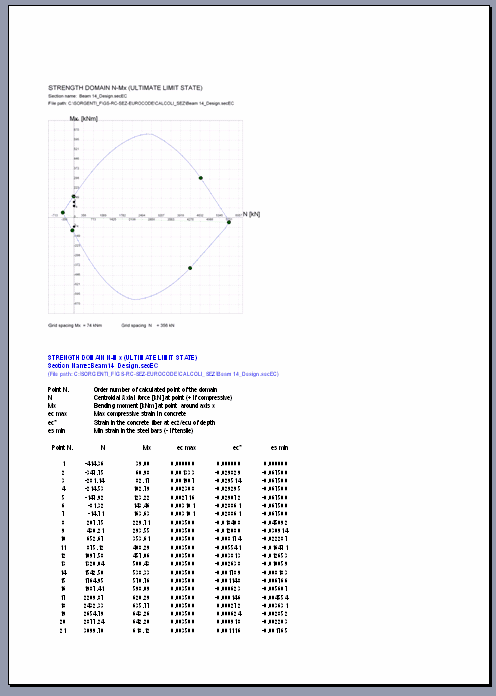
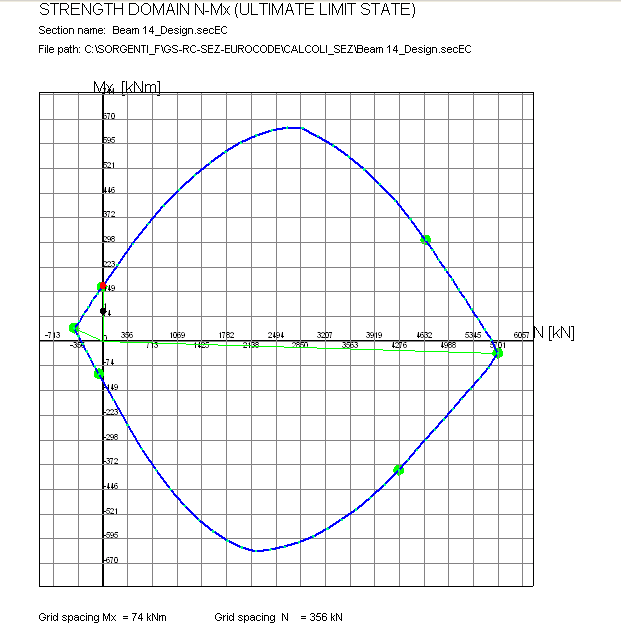
ULS INTERACTION N-Mx DIAGRAM
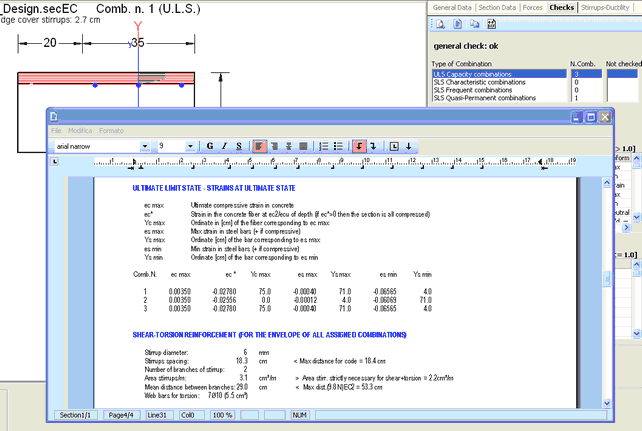
If you select the N-Mx diagram option in Checks window program display the strength diagram N-Mx in the Main window:
The corresponding Information window shows:
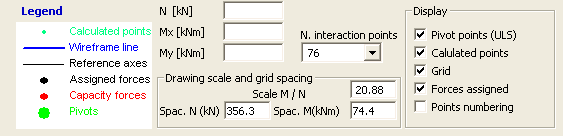
In N, Mx text boxes shall appear the values of calculated points of the domain boundary selected on the graph by mouse. Drawing scale and grid spacings may be modified (rounding their values). Display options can modify the graphical aspect of the diagram.