The search of the first arrivals (also called picking of first arrivals or first breaks picking) is done by clicking with the mouse directly on the seismogram or by entering the times in the grid. The red marks on the seismogram show the values selected for each trace.
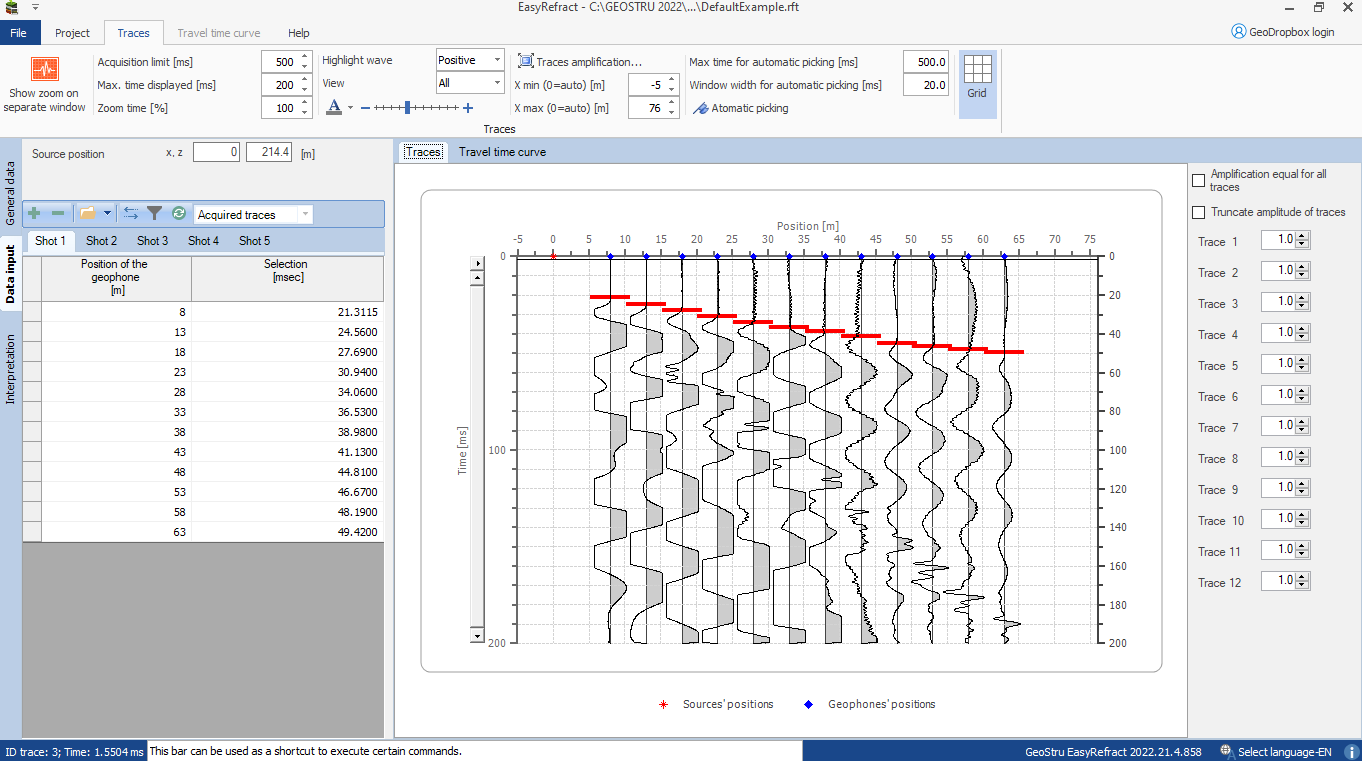
The software is equipped with an automatic picking system that allows a preliminary identification of the first arrivals. This option can be selected from the Traces menu in the menubar.

The algorithm implemented follows the methodology known as Energy Ratio Method. This methodology involves the identification of a time window of the signal to be divided into two equal intervals on which it calculates the energy of the signal. The value for which is the ratio between the energies calculated for the two windows in maximum represents the first arrival of the wave.
Analytically the function energy ratio (er) is determined as:
where L represents the width of the window in samples.
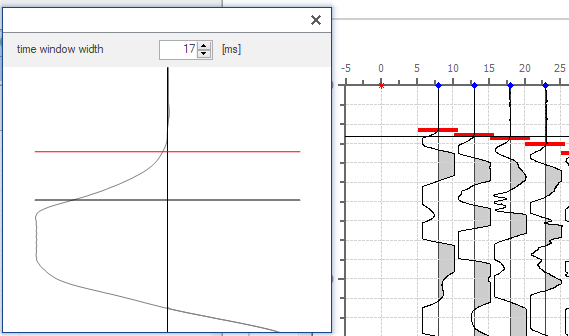
It must be assigned as a parameter of the analysis the width of the window to be used (it is a value assigned in ms which is then converted, via the sampling period, in number of samples). The parameter L, typically, is chosen equal to a wavelength of the signal, detectable by seismogram as the time necessary for the completion of a complete oscillation or as a temporal distance between two crests.
The last parameter to be set is the time within which you want to determine the first arrivals. This approach is essential to improve the search of the algorithm for the best signal/noise ratio.
Some graphic options allow a more accurate control for the selection of the first arrivals.

"Traces amplification" button allows to alter the display of the traces by applying an amplifying factor. For each file used in the processing is given the opportunity to choose a factor for each trace.
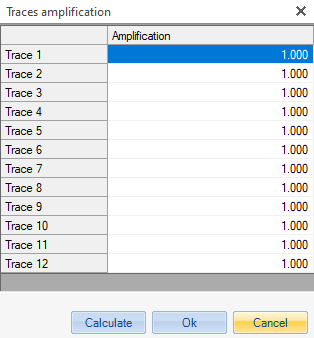
The technique of automatic completion of missing data determines the amplification factor by linear interpolation of the nonzero sides inserted in the grid.
The other display options offer the possibility to fix the working window for the traces ("Max. time displayed"), to expand or collapse the axis of times ("Zoom time"), display a single trace and highlight the positive and negative parts of the waves.
Finally, enabling the option "Show zoom on separate window" shows the detail of the wave for which the first arrival is searched in a floating window where the temporal amplitude interval to be plotted can be chosen.
|
© Geostru