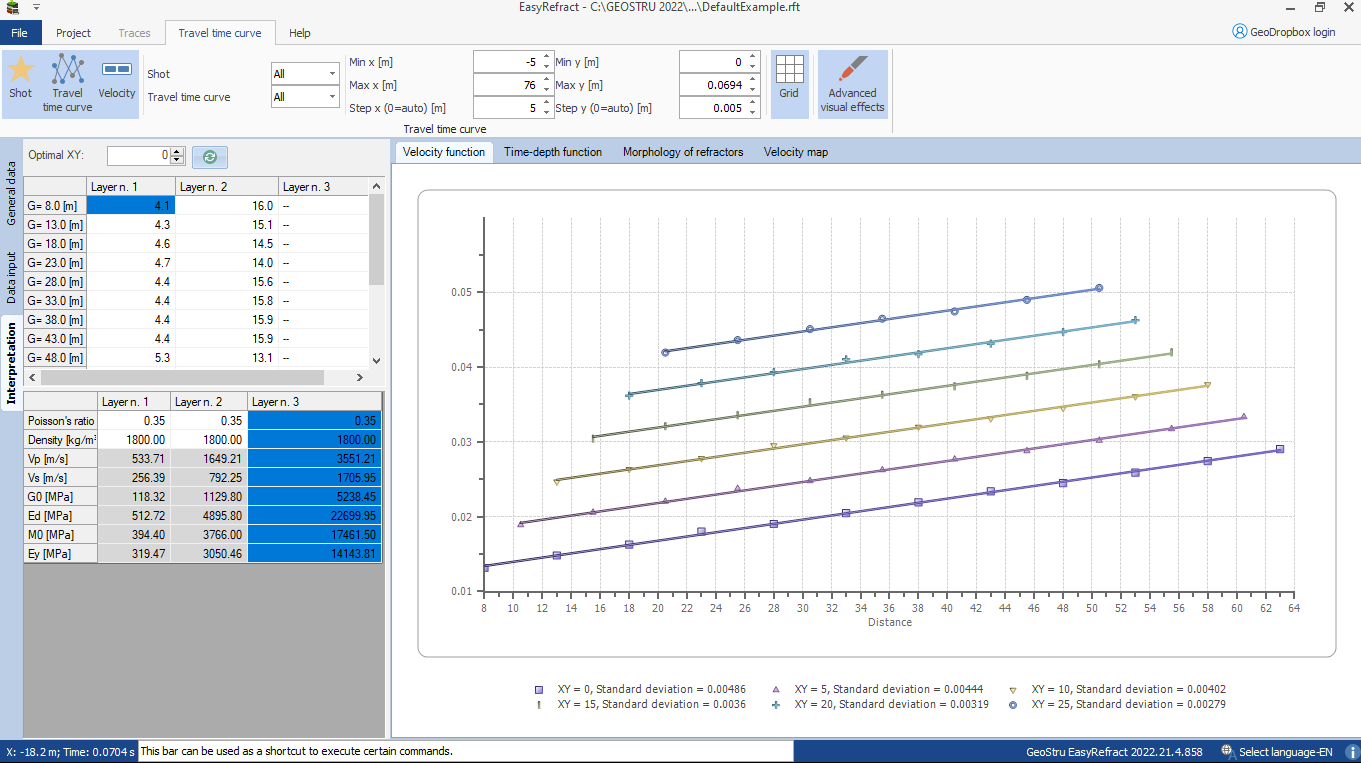
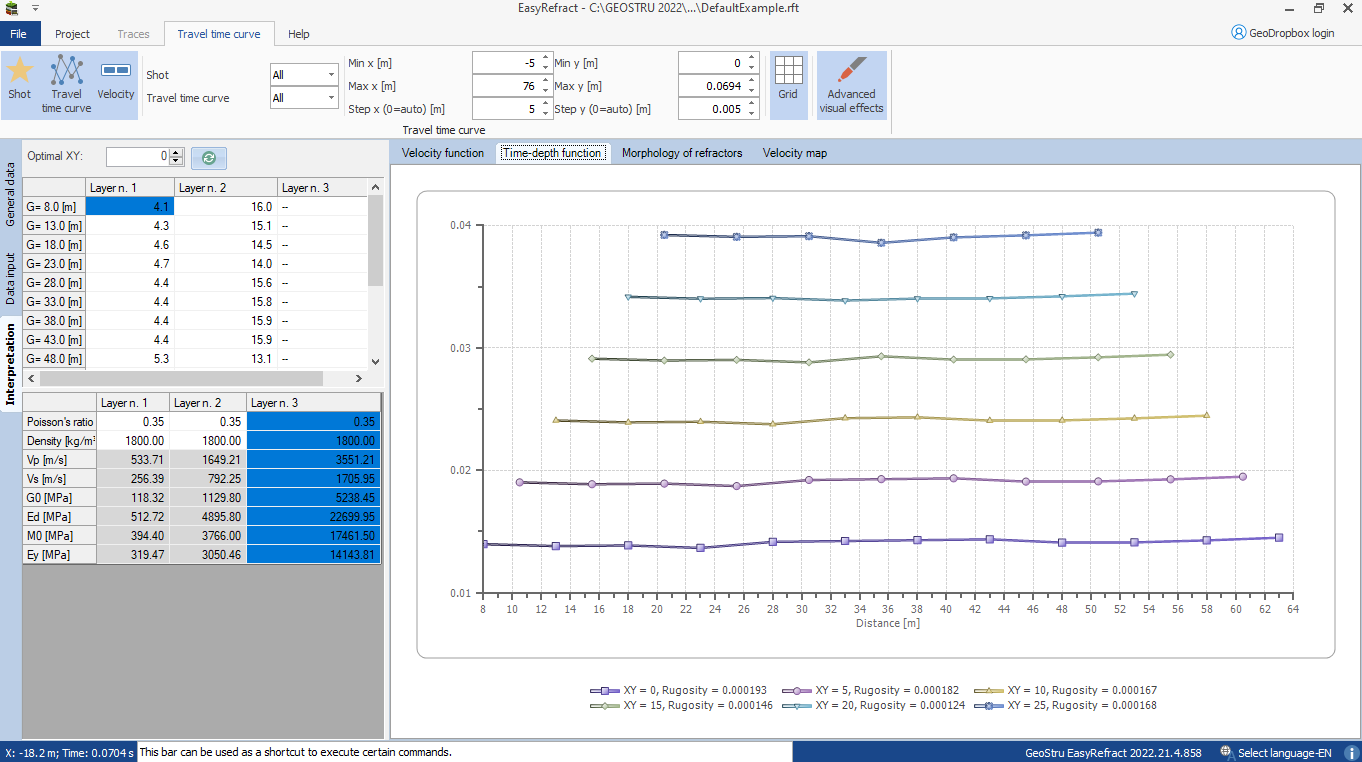
Through the analysis of travel time curves the software processes and displays the velocity function and the time-depth function according to equations (6) and (7). On the diagrams are plotted functions for the values of XY that are between 0 and half the distance covered by array.
The two diagrams are necessary for the determination of the optimal value of XY. The diagram of the velocity function allows to make a comparative evaluation for all considered values of XY. In this diagram are plotted the regression functions and the corresponding value of standard deviation. Clicking on the button showing two arrows "chasing" each other the program is able to automatically determine the optimal XY value choosing the straight line that has the smallest standard deviation.
The diagram of the time-depth function, instead, highlights the articulation that the function assumes for each XY considered value.
The value of XY to be used in the processing may also be selected manually by clicking with the mouse on the diagrams at the curve with the smallest standard deviation or with the maximum articulation
The vertical axis of the diagram is expressed in seconds. However, only the function with XY = 0 is scaled while the others are represented with a time shift. |
|
© Geostru