Legend management
Allows the customization of the layer legend (parameters of the layer to include, position)
Failure wedges
Displays the active, passive and transition failure zones in the work area.
Pressure bulbs
Displays pressure bulbs on the worksheet, that is the development with the depth of the ratio q/q0 where is the pressure induced by the load q0 applied on the bearing surface. Stress increase below the foundation may be calculated with Boussineq or Westergaard methods.
Design normal pressure
Foundation length Corresponds to the foundation section for which the bulb is represented. For example if entered 50% the bulb will be drawn at the middle and then the pressure values will be referred to the middle section of the foundation. Amplitude, along the x axis, of the meshing needed to build the pressure bulb. The step represents the amplitude of the cells.
Mesh construction interval in y
|
It may occur that, as shown in the image A below, the bulbs are only partially visible. To view them completely or in a broader way, a calibration must be done based on the size of the foundation and the values predefined of the interval and the construction step of the mesh in both x and y directions, as shown in the image B.
|
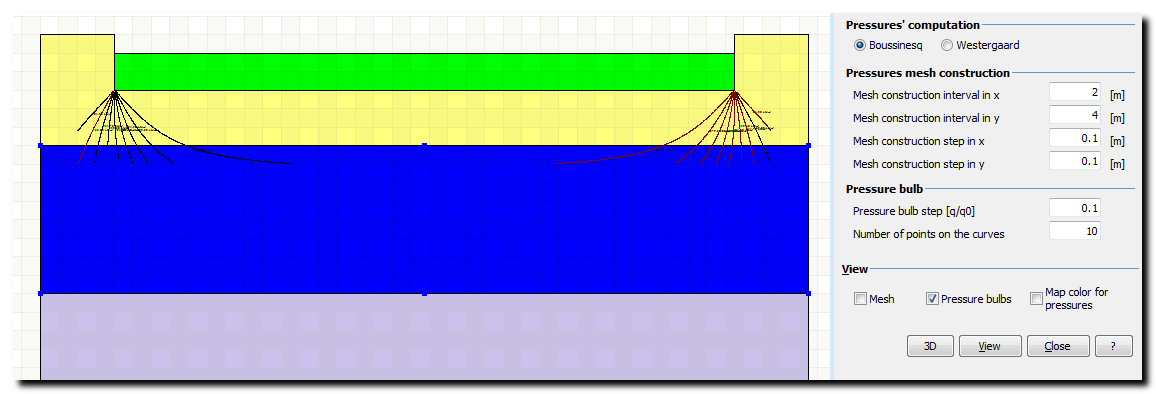
Image A- Partial view of the pressure bulbs
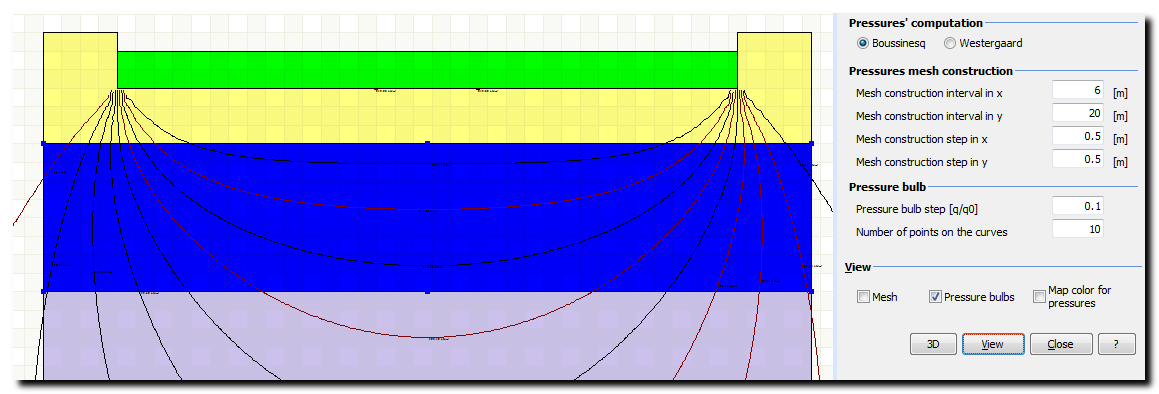
Image B- Calibrated view of the pressure bulbs
Mesh
Displays on the worksheet, the triangular mesh used for the modeling of the progress of the stress state below the bearing surface.
Map color for pressures
Displays pressure bulbs on the worksheet as colored areas.
© GeoStru