Ductility checks concern the following sections for structures in seismic zones:
•within critical regions at the ends of all the beams (DCM, DCH). [Not secondary beams]
•within critical regions at the base of columns in DCM
•within all critical regions of columns in DCH
•within critical regions of ductile walls (DCM, DCH)
To respect the local ductility in the above critical regions the curvature ductility factor μΦ must comply with the rule in §5.2.3.4 EC8:
μΦ ≥ 1,5 (2q0 - 1) if T1 ≥ TC (5.4) EC8
μΦ ≥ 1,5 [1+2(q0 - 1)] TC/ T1 if T1 < TC (5.5) EC8
where:
q0 basic value of the behaviour factor
T1 fundamental period of the building
TC period at the upper limit of the constant acceleration of the spectrum
For beams EC8 allows to replace (5.4) above control with the equations (5.11), (5.12).
For columns EC8 allows to replace (5.4) above control with the relation (5.15).
For beams ductility check is normally performed by the program applying the eq. (5.11),(5.12) EC8 that that is, controlling the maximum and minimum tension reinforcement ratio of longitudinal bars.
For columns ductility check is normally performed by the program controlling the stirrups confining and applying the following disequation:
α wwd ≥ 30 mΦ nd εsy bc/b0 - 0.035 (5.15) EC8
where:
α = αs · αn = confinement effectiveness factor
wwd = (volume of confining hoops/volume of concrete core) · fyd/fcd = (Ast,x/(s· b0) + Ast,y/(s · h0)) · fyd/fcd = wx + wy
mf = curvature ductility facto.
nd = NEd / (Ac fcd) = normalized design axial force
εsy = design value of tension steel strain at yield
bc = gross cross-sectional width
b0 = width of confined core
Eq. (5.15) should be applied in both directions x ed y (in a rectangular section):
α wwd ≥ 30 mΦ nd εsy bc/b0 - 0.035
α wwd ≥ 30 mΦ nd εsy hc/h0 - 0.035
Note that care must be taken to ensure the same ratio of transverse reinforcement that is to be approximately wx = wy .
As the program operates in biaxial bending and biaxial shear the last two formulas (5.15) EC8 are redefined as a function of only the actual y-direction inclined (as wwd is the sum of both the amount of shear reinforcement in the two directions perpendicular of the section) of neutral axis and the relative amount of transverse reinforcement effective in only one direction y:
α wy ≥ (30 mΦ nd εsy dc/d0 - 0.035) / 2
where dc e d0 are equivalent to the transverse dimension (bc,hc) and the corresponding dimension of the confined core (b0,h0) obtained from the biaxial shear check. Then the control of the local ductility of the section is performed only once by the program for each of the seismic combinations and not twice (separately for the directions of the axes x and y) for each combination.
In the case of the sections belonging to existing structures calculated with non-linear method (pushover) the ductility in bending can no longer be calculated with the previous reports simplified (valid only in the case of calculation with behaviour structure factor q), but in its place must be assessed the capacity of rotation (of ductile mechanisms) from the ultimate curvature and the yield strength which, at the same time, define their relationship with the ductility in bending. The best way to figure these relations is to track the diagram bending moments-curvatures to which is dedicated the continuation of this paragraph. It is recalled that the maximum ductility demand for the columns is required in sections of attack with the foundations in which the model of seismic behavior provides for the formation of plastic hinges; in other critical areas of columns the ductility demand is lower (should not form plastic hinges thanks to the respect of the capacity design rules) and, for these areas, the EC8 does not require specific checks in DCM (for DCH also requires verification of ductility within the other critical regions of the columns but with reduced demand).
Curvature ductility factor μΦ of the critical regions is defined as the ratio of the post-ultimate strength curvature 85%- of the moment of resistance, to the curvature at yield, provided the limiting strains of of concrete and steel εcu and εsu,k are not exceeded.
EC8 does not provide details on both the meaning of the above definition or operational modalities with which to conduct the direct calculation of the said ductility factor. In the following we will refer to the specialized literature and to the first draft of Eurocode 8.
For a comprehensive evaluation of the ductile behavior of a section subjected to a constant normal force N is necessary to trace the diagram moment-curvature using the relationship stress-strain based upon the mean values of resistance (not the ones used for the design resistance check) of the concrete and steel.
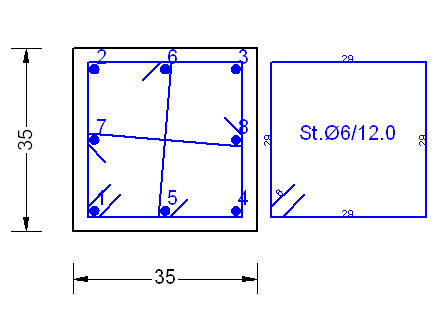
To fix the ideas consider the below section (35x35 cm) of a column (reinforced with 8Φ18 longitudinal bars and with Φ6/12cm hoops and cross-ties) and its diagram Moment-Curvature (for N = 400 kN) obtained on the basis of the mean strength value for conglomerate (parabola-rectangle fck = 30 Mpa, fcm = 38 Mpa and εcu = 0.0035) and steel B450C (fym = 480 Mpa, fsum = k⋅fym with k=ftk/fyk and εsuk = 0.0075). The ratio between the ultimate curvature (0.046600 1/cm) and the yield strength curvature (0.013044 1/cm) provides the following value of the ductility factor mΦ = 3.57. The same section is studied in the example "Ductility check".
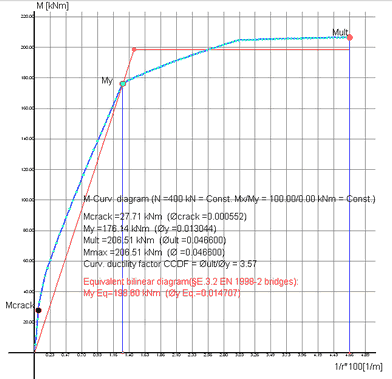
The low ductility factor obtained in this way is clearly unsatisfactory for a structure in a seismic zone calculated for example with a behaviour factor q0 = 3.5, because for the above (5.4) it is required a ductility factor μΦ ≥ 2 × 3.5 - 1 = 6.0. The only factor that can improve the ductility is the increase of the ultimate strain concrete, which can be achieved by means of a dense stirrup confinement. In fact the increase of the confining pressure exerted by the stirrups on the concrete core produces an increase of the resistance fck (to fck,c) and of the strains εc0 ed εcu (to εc0,c and εcu,c) as you may see in the below stress-strain relationship diagram.
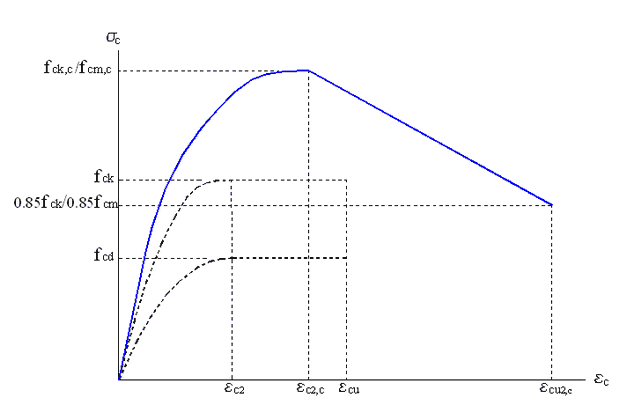
Blue line show the confined stress-strain relation of the confined concrete core of the section: the ascending branch has a parabolic form unlike the descending straight branch (softening effect) that is similar to the trend of a Kent-Park relationship type but here it is conventional and do not depends by the quantity of stirrups. Mean value of the confined strength (fcm,c) is most suitable than the the characteristic (fck,c) in ductility assessment. The main variables that determine the confinement effect are:
- the ratio between the volume of the stirrups and the volume of the corresponding confined concrete (high amount of steel match high confining pressures);
- the yield stress of the steel of the stirrups as it provides an upper limit to the confining pressure explicable;
- stirrup spacing increase which reduces the effect of the arc confining pressure;
- the ratio between the diameter of the bar of the stirrups and the length of the largest side of the stirrups, due to the flexural stiffness that the bar plays in its plan to develop the confining pressure (this problem is not present in circular columns while for rectangular columns is resolved by transverse ties that connect the longitudinal bars and at the same time the hoops).
For predefined section, rectangular section of columns and for general section consisting of only one concrete region the program can perform a direct ductility check (moment-curvature analysis based) automatically generating the above confined stress-strain relation based on the actual assigned hoops and cross-ties.
For the same typology of sections it is also possible to perform the direct ductility check using the following specific values of confined concrete parameters assigned in the Materials Library (in this case you may directly model the inclination of the decreasing branch of the above diagram) :
- fc max = fcm,c (max strength in the above graph)
- fc ult = 0.85 fcm,c (ultimate strength in the above graph)
- ec 0 = εc2,c (strain at fc = fcm,c)
- e0 ult = εcu2,c (ultimate strain)); if εc > εcu2,c then fc=0
- fcm = fcm max compressive stress for concrete part outside the confined core: if εc > εcu (usually 0.0035) then fc=0
Parameters used in the ductility check for the steel bars are:
- Es = Esm
- fym = fym mean yield stress of stirrups steel
- fu = k ⋅ fym (ultimate strength) where k = ftd/fyd assigned in material library for the stirrups steel
Let's now suppose that the above square section is within the critical region at the base of a column to design in ductility class DCM. The Local ductility condition (5.4) EC8 can be checked (this is the usual way) by means of the (5.15) relation that we firstly apply only with reference to Y direction (mf= 6.8 min value required):
wY ≥ (30 mΦ nd εsy hc/h0 - 0.035) / (2 ⋅ α ) (furthermore wY ≥ 0.08/2 = 0.04)
where first member is:
wY = Ast,y /(s · h0) · fyd / fcd = 0.84823 / (12.00 · 29.4) · 391.3 / 20.0 = 0.047
- Ast,y = 3 · 0.28274 = 0.84823 cm² (area of 3 legs Φ 6)
- s = 12 cm (pitch of stirrups)
- h0 = 35 - 1.8/2 - 0.6/2 = 29.4 cm (dimension along dir. Y of the confined core section measured between centreline of hoop )
and second member is:
(30 mΦ nd εsy hc/h0 - 0.035) / (2 ⋅ α ) = (30 · 6.8 ⋅ 0.1633 ⋅ 0.001956 ⋅ 1.1905 -0.035) / (2 ⋅ 0.4554) = 0.0467 < wY = 0.047 > 0.04 (A)
- nd = NEd/(Ac·fcd) = 400000/(350²·20) = 0.1633 (normalized design axial force)
- εsy = fyd/Es = 391.3/200000 = 0.001956 (design value of tension steel stirrups strain at yield)
- hc/h0 = 35/29.4 = 1.1905 (ratio of gross sectional depth (Y direction) to width of confined core)
- α = αn · αs = 0.7189 · 0.6335 = 0.4554 (confinement effectiveness factor)
- αn = 1- ∑bi2/(6×b0×h0) = 1 - 8·13.5/(6·29.4·29.4) = 0.7189 [from(5.16a)EC8]
- αs = (1-s/2b0)(1-s/2h0) = (1-12/(2·29.4))2 = 0.6335 [from(5.17a)EC8]
[For a generic polygonal section αs = Ac0/A0 where A0 is the area enclosed by the centreline of the hoop perimeter and Ac0 is the area of the polygon interior to A0 obtained with an offset of the sides of A0 equal to s / 4. Always a polygonal cross section in the formula of the product an b0·h0 is replaced with the newly defined area A0.]
In (A) we see that the ductility check (5.15) is satisfied in Y direction.
If we use the same eq. (5.15) with a 45° inclined direction and with the same value for mΦ we have also a positive conformity for local ductility:
w45° = 0.049 > 0.047
Now we want to check local ductility by means the moment-curvature diagram with the above stress-strain relation for mean confined value of strength.
To evaluate confined parameters of concrete we calculate first the effective lateral compressive stress σ2 (generated by the designed closed link and cross-ties) with the following experimental formula (see Model Code 1990):
σ2 = 0.5 · fcm · α · ωw = 0.5 · 38.0 · 0.4554 · 0.06074 = 0.526
where:
ωw = (volume of confining stirrups / volume of concrete core) · fym/fcm = (6 · 29.4 · 0.28274 / (12 · 29.4²)) 480.0/38.0 = 0.0607
Known σ2 we can apply EC2 formulas (3.24), (3.25), (3.26), (3.27) to assess the parameters of confined concrete:
fcm,c = fcm (1,000 +5,0 σ2/fcm) if σ2 ≤ 0,05 fcm
fcm,c = fcm (1,125 +2,5 σ2/fcm) if σ2 > 0,05 fcm
fcu,c = 0,85 · fcm
εc2,c = εc2 (fcm,c/ fcm)²
εcu2,c = εcu + 0,1 · α · ωw
In our case σ2 < 0,05 fcm = 1.9 Mpa then:
fcm,c = 38 (1.000 + 5.0 · 0.526/38) = 40.6 Mpa
fcu,c = 0.85 · 38 = 32.3 Mpa
εc2,c = 0.002 (40.6/ 38)² = 0.00228
εcu2,c = 0.0035 + 0.1 · 0.4554 · 0.06074 = 0.00626
Note the increase, thanks to the confining stirrups, of ultimate concrete strain εcu2,c (almost 2 times the not confined concrete value 0.0035).
In the below figure is shown the moment-curvature diagrams with the new confined parameters and the corresponding stress-stain relation (blue line in the above graph).
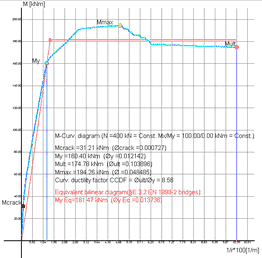
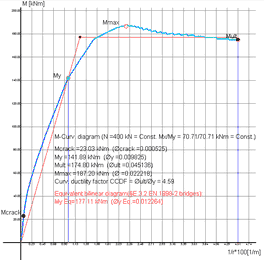
The diagram on the left refers to the uniaxial direction Y from which we obtain a good (conformity OK) ductility factor mΦ= 8.56 > 6.8 (min required value); note the sudden drop of the diagram for the crushing of the cover (not confined concrete).
The diagram on the right refers to the biaxial direction 45° inclined (in each point of the biaxial diagram the ratio Mx/My is held constant and equals to the ratio of ULS design moments) from which we do not obtain a sufficient (conformity Not Ok) ductility factor mΦ= 4.59 < 6.8 (min required value); in general for all inclined direction of the seismic forces ductility factor mΦ is less than than the uniaxial directions X or Y. Note that the above application of the (5.15)EC8 for the 45° inclination leads to a positive ductility check in contrast with the more realistic assessment obtained with the moment-curvature diagram.
An additional moment-curvature diagram generated by the program (lower option in the stirrups-ductility window) is based on the mean compressive stress-strain low described in § 3.1.5 EC2 for not linear analysis of frames.
For this last diagram it is also possible to assign the % of the mean concrete tension strength fctm to take in account in the tension region of the following assumed stress-strain diagram:
|
© 2020 Geostru