From this section the user can choose all the methods implemented in the program for the liquefaction check.
The choice can be made from the controls placed on the standard toolbar (section 1), from the panel located to the left side of the work area (section 2) or using the commands in section 3.
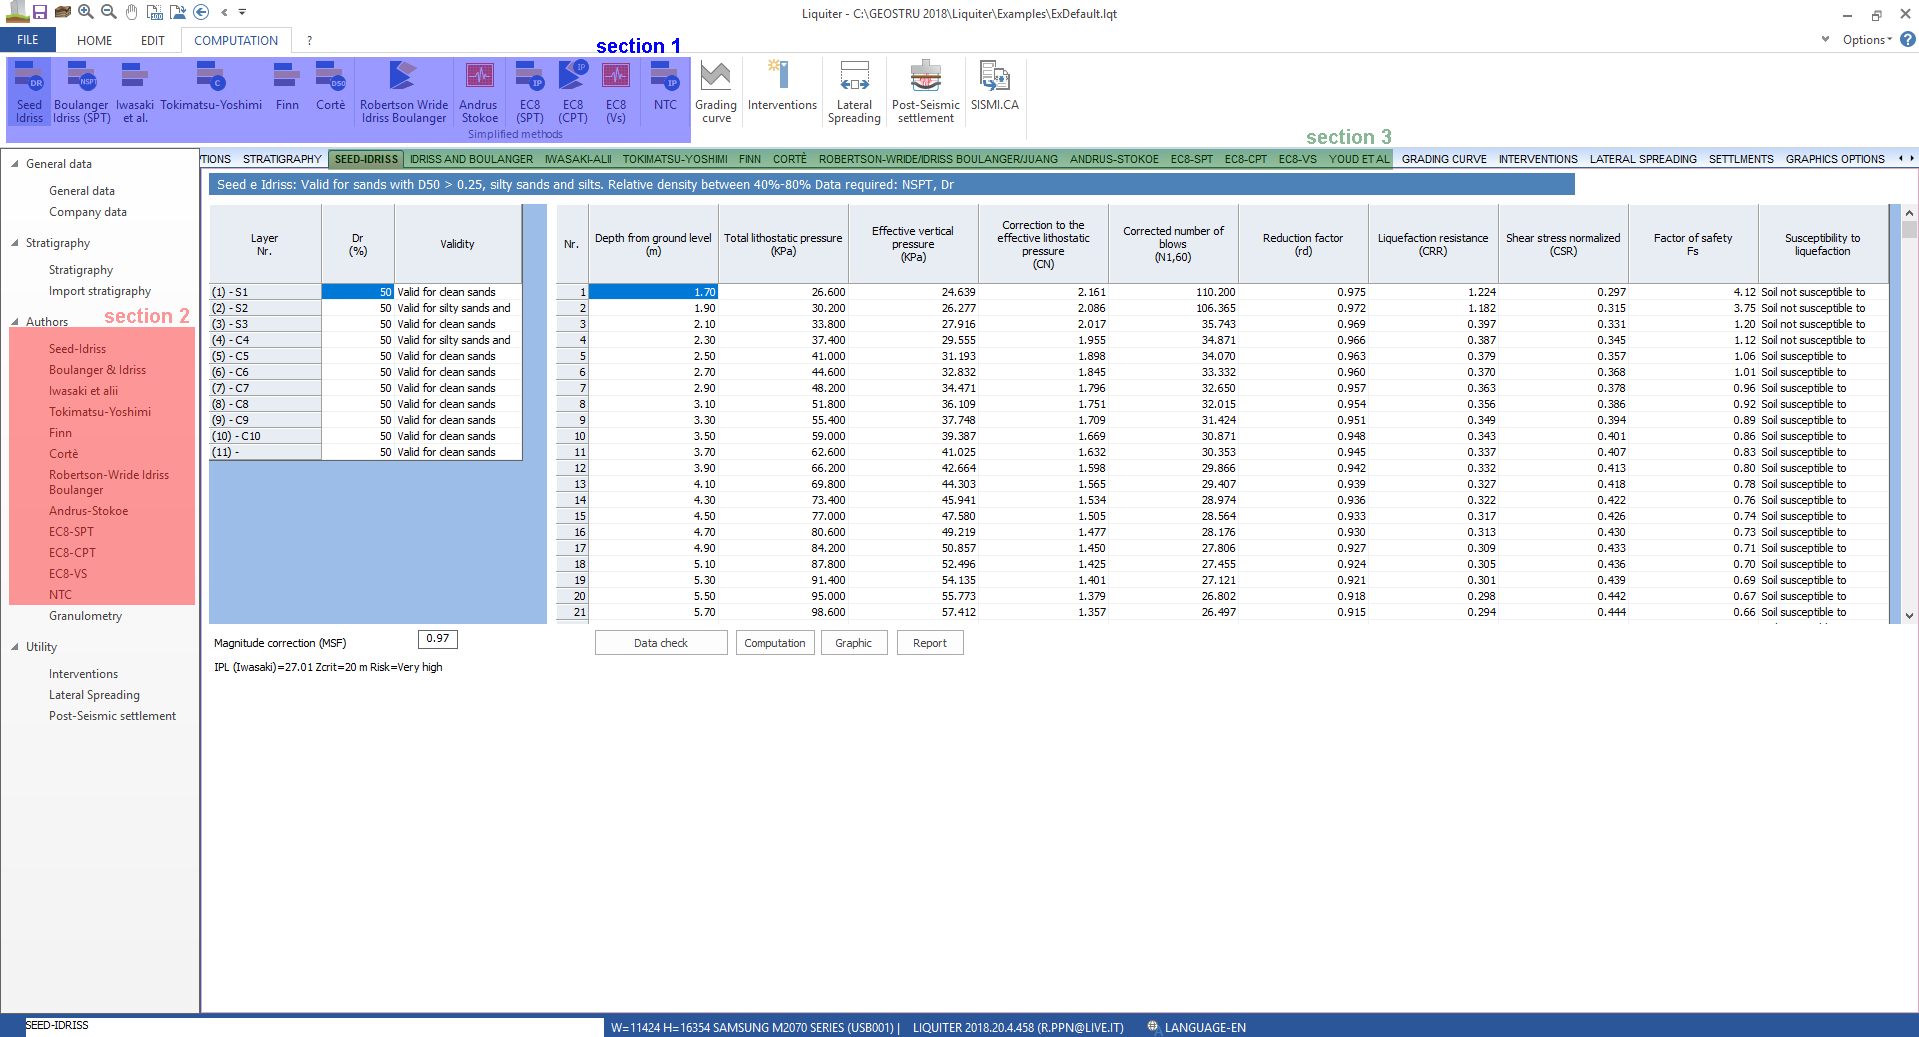
Let's choose an example: method Seed Idriss
in section 4 are shown the validity conditions and the data required to perform the analysis, in this case: The method is valid for sands with D50> 0.25, silty sands and silts. Relative density between 40-80%, the data required for processing are NSPT and the D50 to be assigned in Stratigraphy.
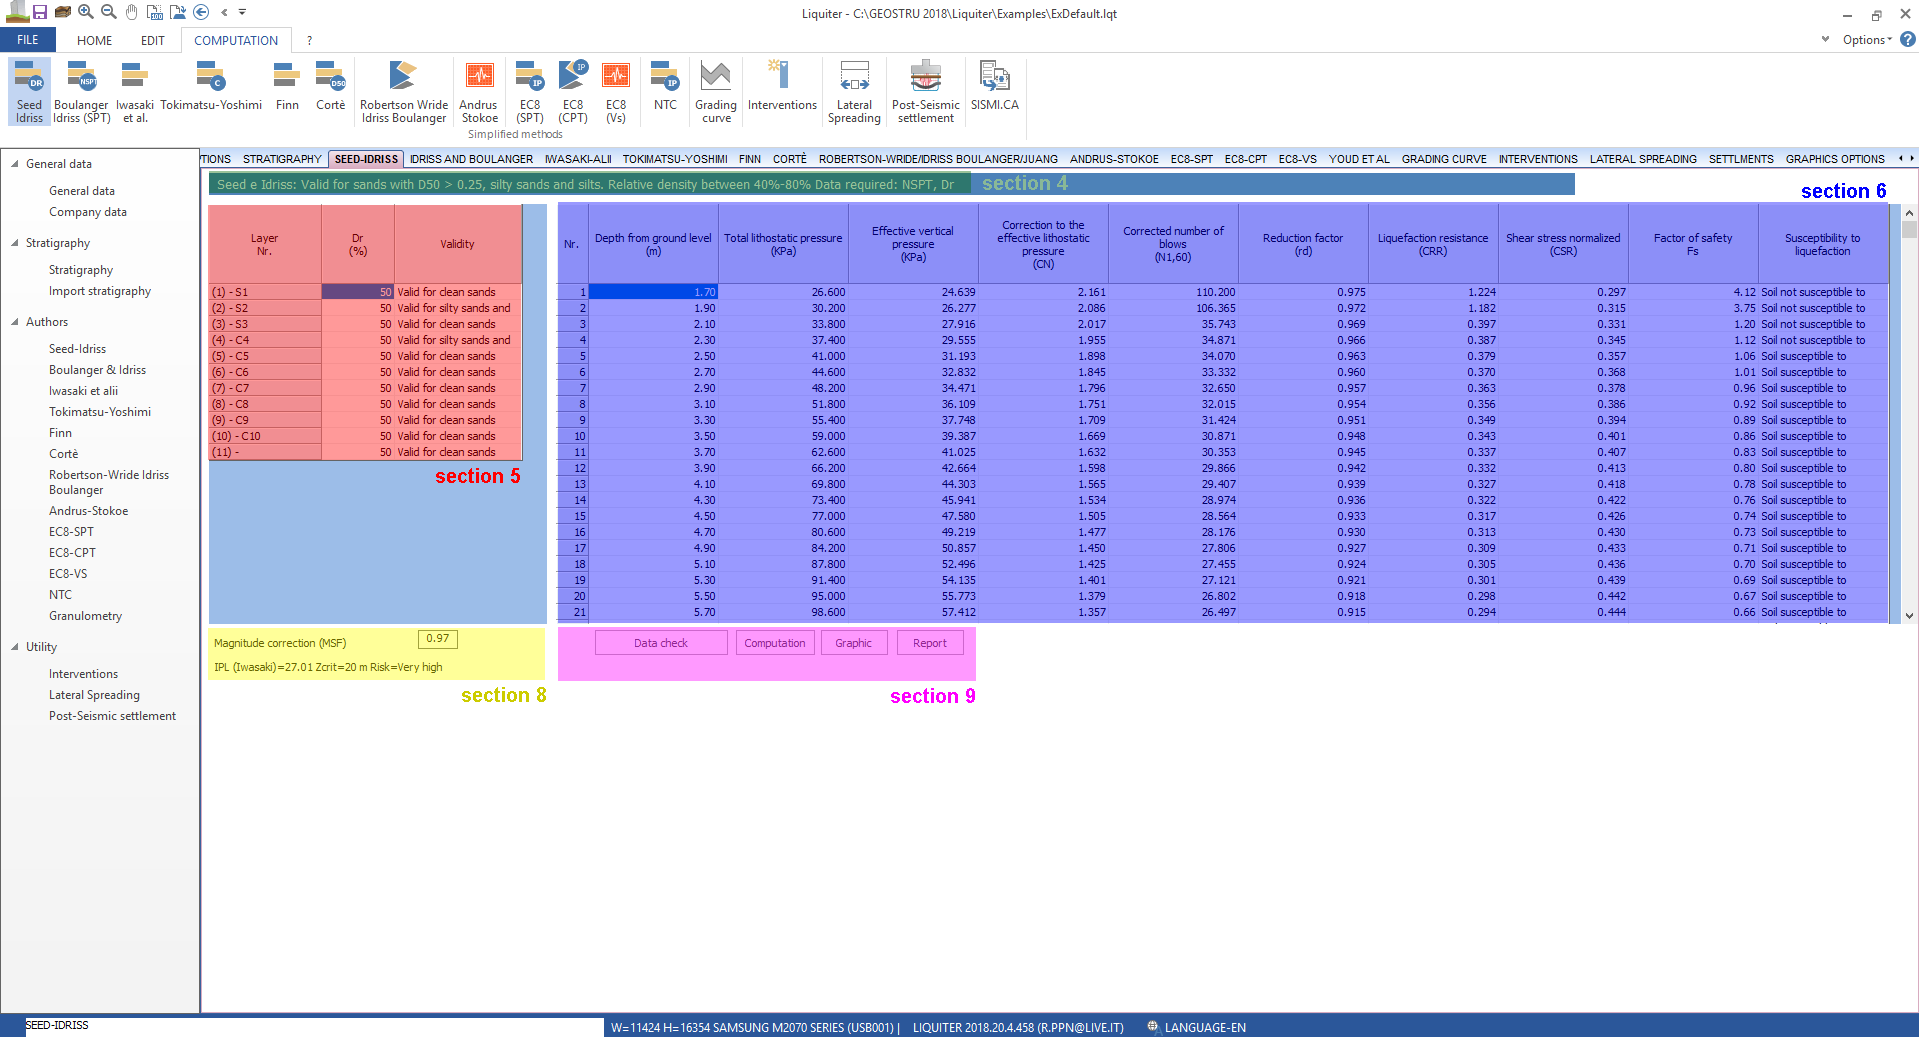
After assigning the stratigraphy it must be defined, in the table from section 5, the validity options of the method layer by layer. The program processes the data and returns the results in the table in section 6 providing the results of the analysis. The results reported in this table can be exported using the copy/paste command.
For earthquakes with a magnitude greater than 7.5 is calculated the value of the correction factor on the magnitude MSF using the correlation or the method chosen in the Analysis options. The calculated value is shown on screen as well as the index of liquefaction potential (IPL). The chosen computation method: Idriss or Sonmez, assigned value to critical depth zcrit:10 or 20 m and the risk associated with it (section 7).
The program offers an accurate computation report, including the theoretical references and organizing the analysis results in tabular form. After processing the data, it can be generated a graphic that, in the case of Seed and Idriss, is structured as follows: (stratigraphic column-depth, NSPT-depth, FS-depth).
To generate the output just select the specific commands (section 8), the report and the graphic options can be changed from the Report options.
N.B.: The options for the computation of the liquefaction potential can be found in the section Analysis options.
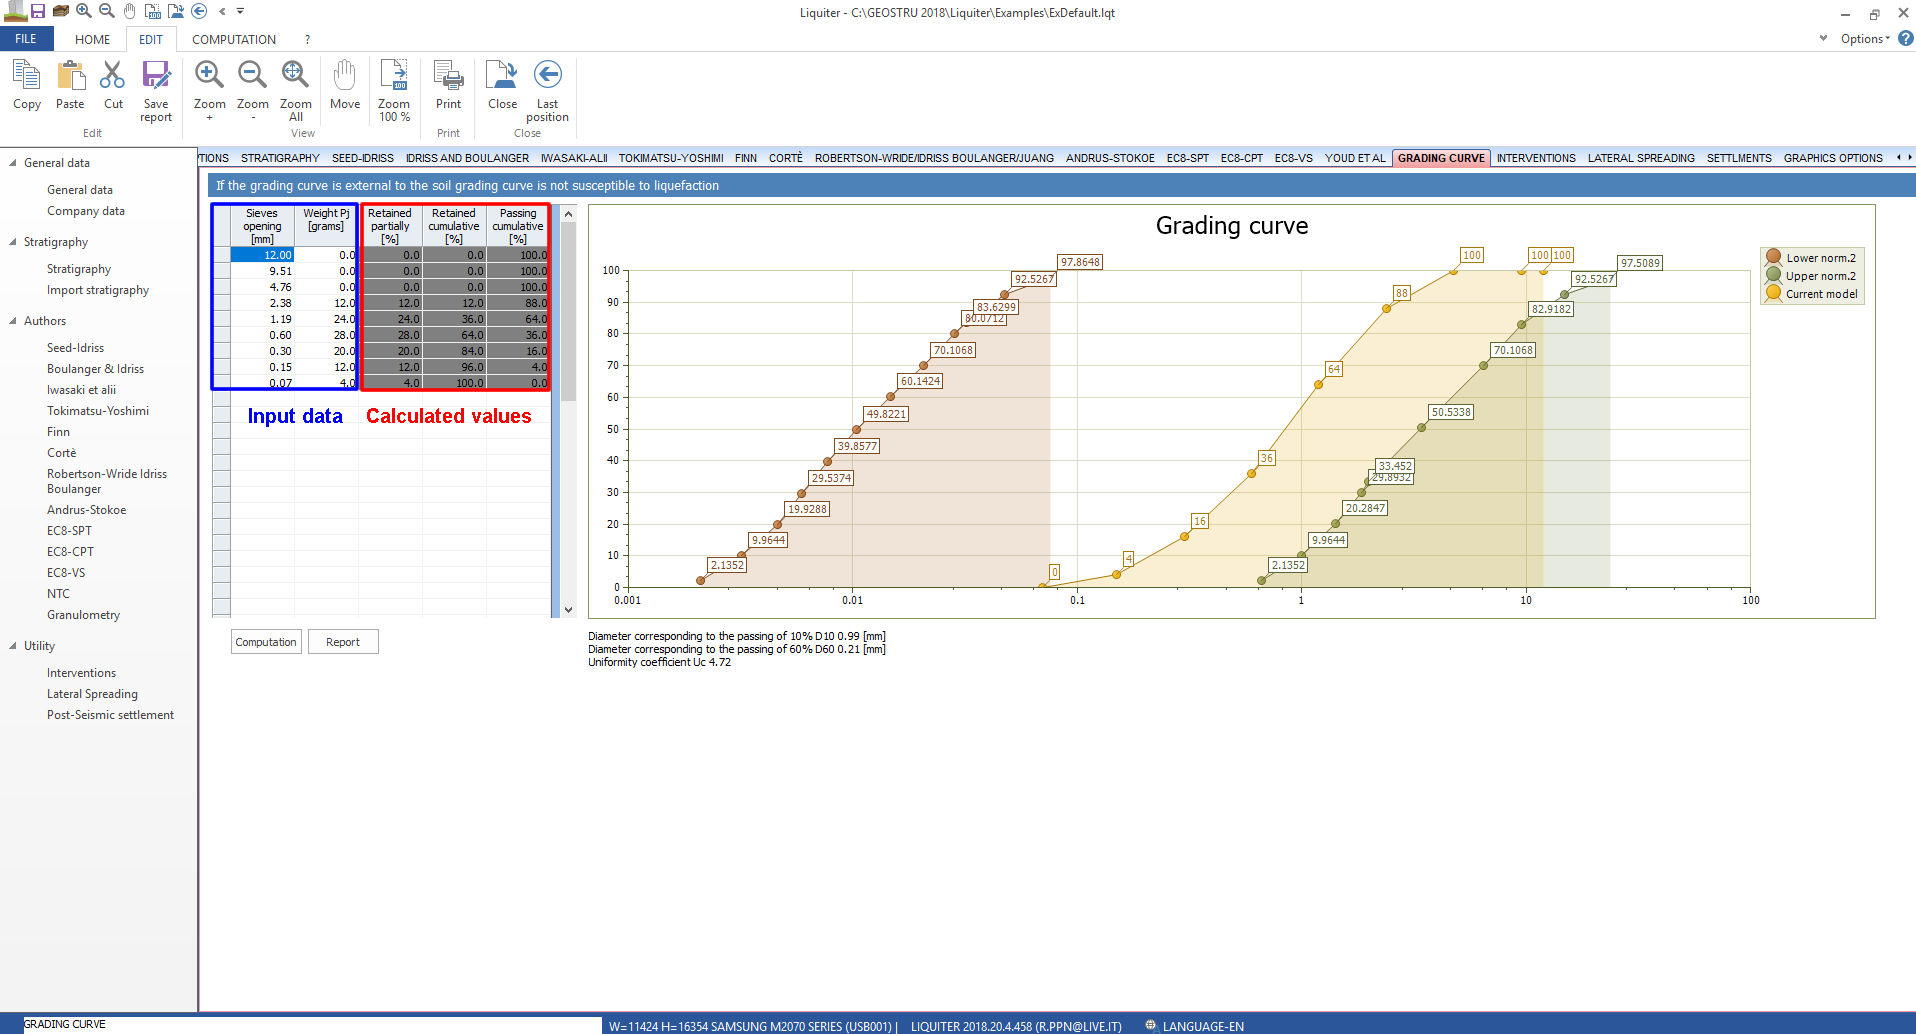
Grading curve
If the granulometric distribution of the soil is external to areas indicated as "critical", the liquefaction verification can be excluded, the soil is not susceptible to liquefaction.
The command opens a window consisting of a table and a graphic. In the table must be inserted:
•Sieves opening (the ones from the A.S.T.M. series, in descending order, are: 38.10 mm, 25.40 mm, 19.00 mm, 12.70 mm, 9.51 mm, 4.76 mm, 2.38 mm, 1.19 mm, 0.595 mm, 0.297 mm, 0.149 mm, 0.074 mm.)
•Weight Pj - the weight of the grains retained partially. The software calculates the grains retained partially (%), cumulated retained grains (%) and cumulated passing grains (%). While this data is entered the software plots the grading curve of the current soil model, together with the lower and upper grading curves indicated by the normative (lower norm, upper norm.) for uniformity coefficient Uc< 3.5 and for Uc > 3.5
By clicking on the "Report" button the graphic and the table are prepared for print.
The report can be saved in *. bmp format using the command "Save as"on the standard toolbar (or right click on the graphic).
© Geostru