At the end of the analysis (non-linear equivalent analysis is generally recommended to obtain the response spectrum), you can view the results from the Analysis and Results panel, ‘Plot results’ button. This will display the mesh used to perform the analysis. Clicking on ‘Show spectrum’ will display the previously defined monitored nodes (see figure).
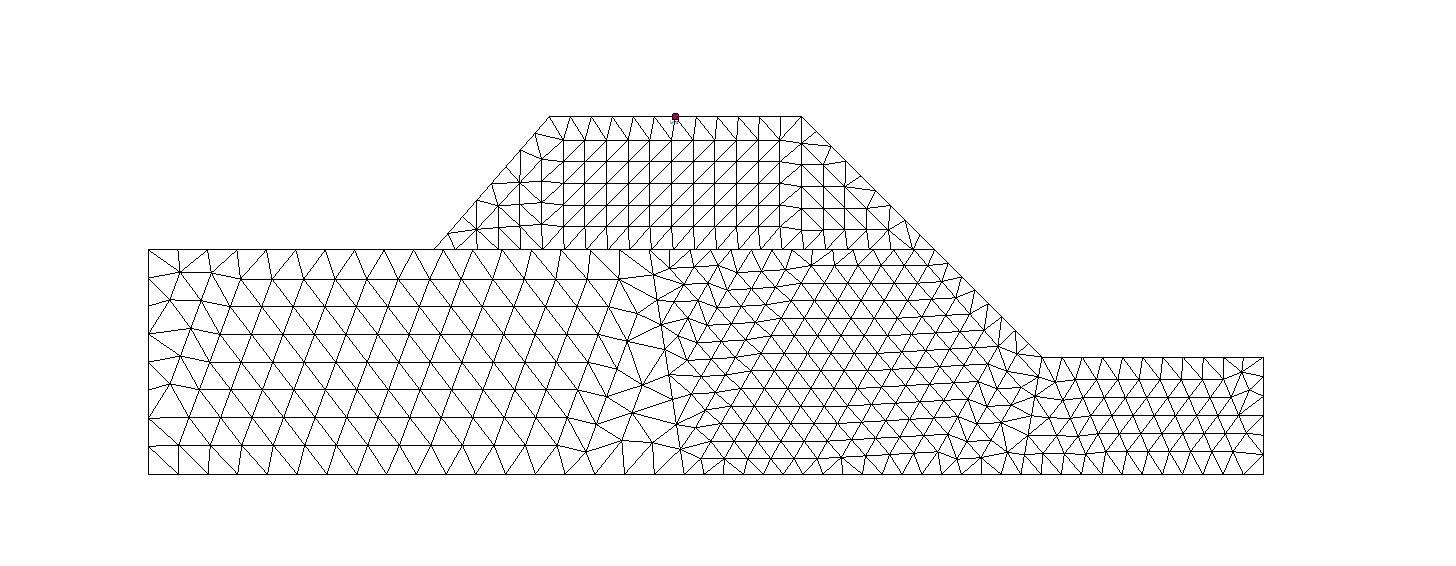
By clicking on the chosen node, the following window appears for the generation of the spectrum obtained.
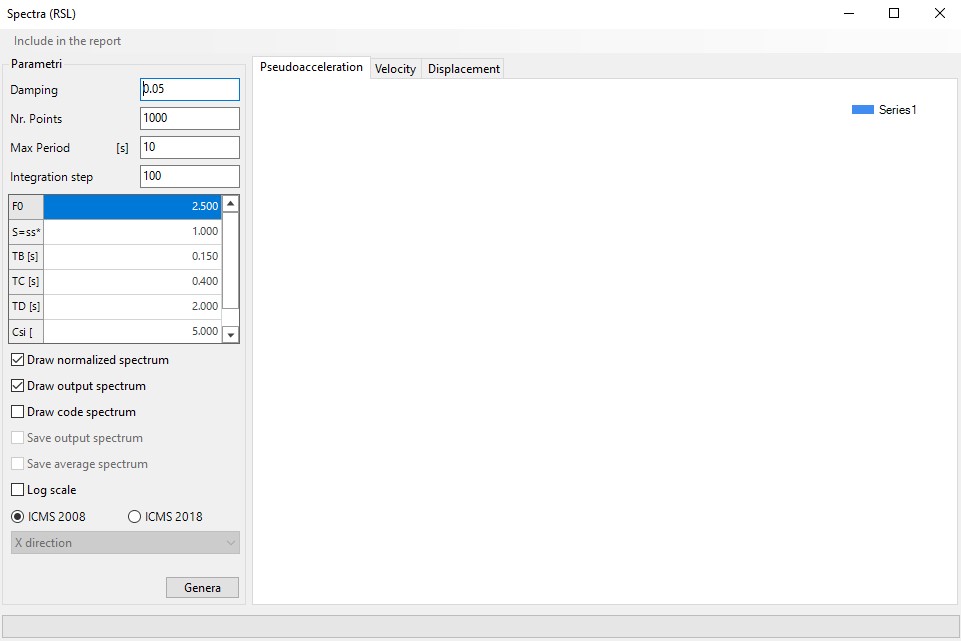
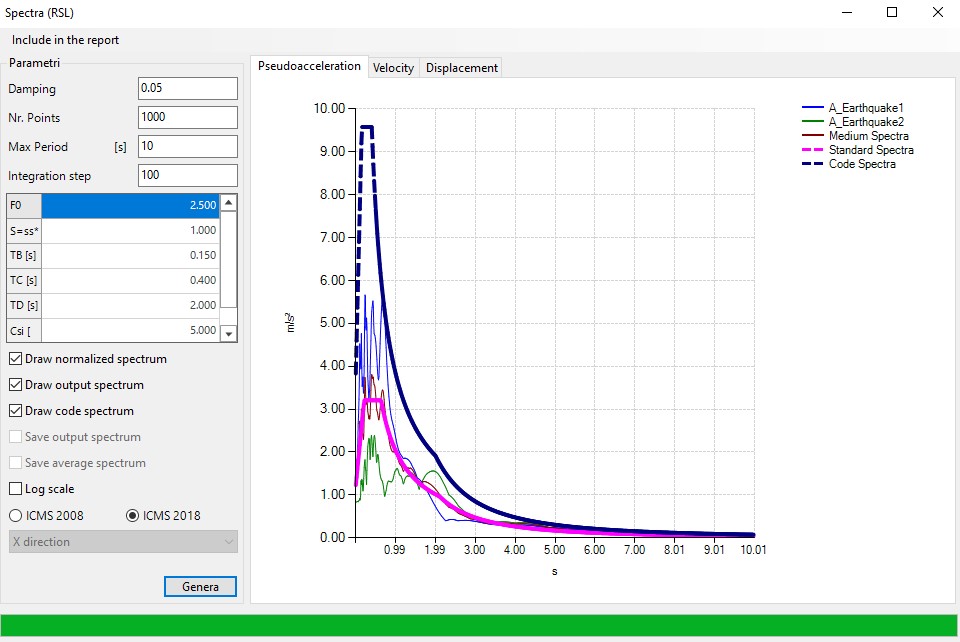
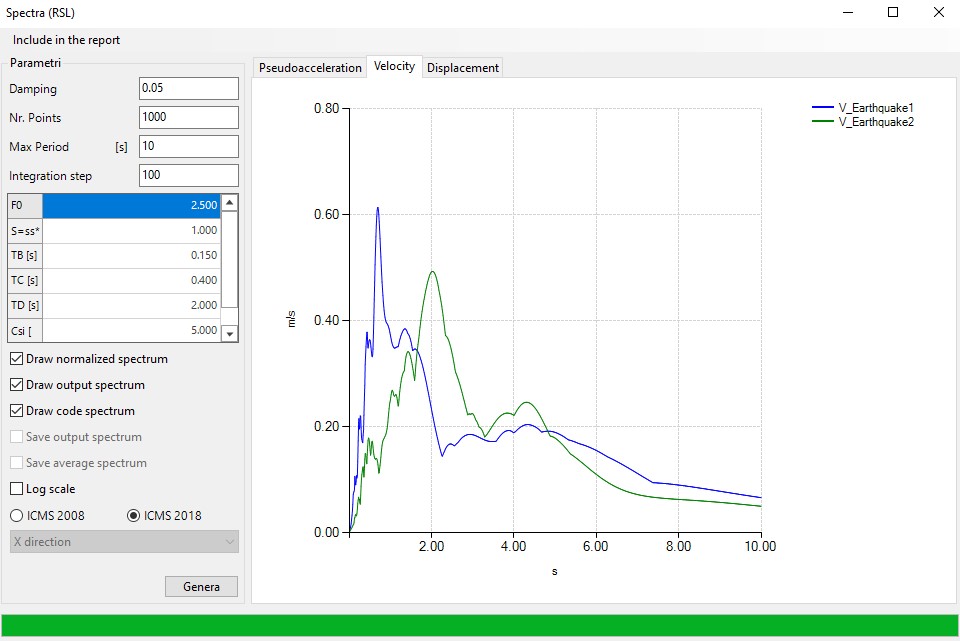
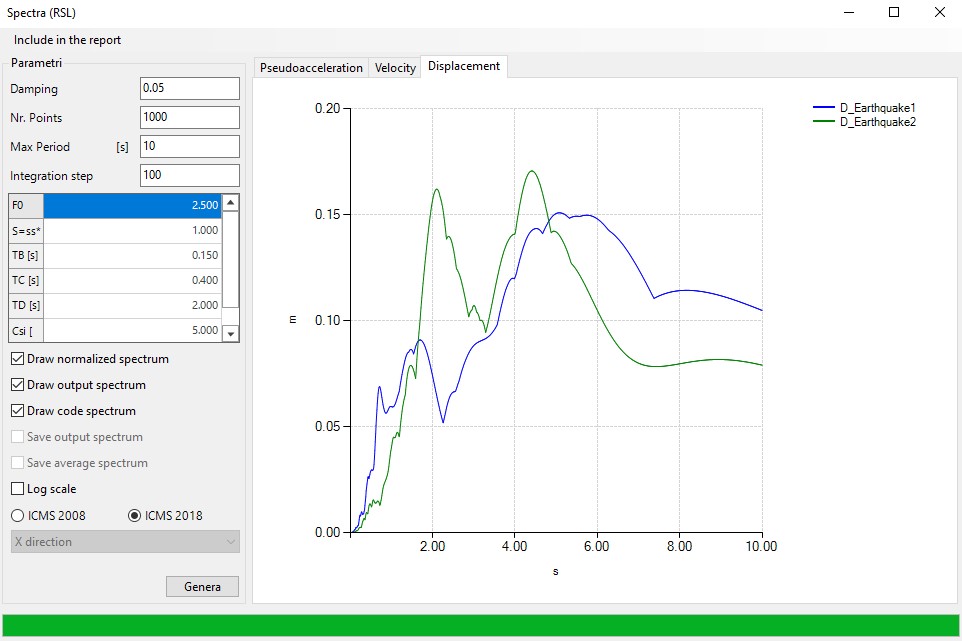
From this window, it is possible to generate the output spectrum calculated by the software, the normalised spectrum and the normative spectrum, depending on the required input parameters. By clicking on the ‘Generate’ button, the spectrum in terms of acceleration, velocity and displacement will be displayed. Some examples are shown in the following figures.